| Home | Revision | GCSE | Statistics | Stem And Leaf Plots |
Stem And Leaf Plots
A particularly nice way of initially presenting data is in the form of a stem and leaf plot. It is useful for organizing small amounts of data and for finding out the median and range quickly.
Here is some data on the amount of change (young) pupils had in their pockets (as usual made up to illustrate a point!).
34, 73, 65, 23, 29, 76, 45, 54, 54, 65, 23, 84, 70, 30, 25, 26, 47, 65, 34, 15, 70, 50, 36
Firstly we draw a vertical bar and on the stem side we write down the numbers 0-9

Now we go through our list of numbers and write them down the leaf side. The key to this is that the number 39 is such that the stem is the 3 and the leaf part is the 9, so 3|9 is 39
If we now have the number 38 we write 3|9 8
If we had the number 30 we would write: 3|9 8 0 and so on.
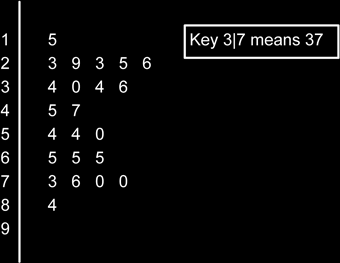
Now we make sure that the leaf parts are ordered in ascending order (small to large)
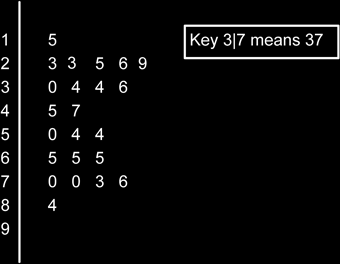
This is the completed Stem and Leaf diagram. Note that there must be a key.
Using this diagram we can see that the smallest value is 15p (the 1|5) and the largest value is 84p (the 8|4). The range is therefore 84-15 = 69p. The median is the middle value. There are 23 values, so the median is the ½ (23+1)th item = 12th item which is 47. Note you only count the leaves, not the stem and leaves.
You could work out the quartiles as well if you wanted to. To do this for the lower quartile we calculate the ¼ (n+1)th value and locate that. (Note that for GCSE it is likely that this will result in a whole number. If not then you are going to need to interpolate the value required by finding the required fraction into the interval between the values. So for instance if you needed the 3.25th value and the 3rd value was 6 and the 4th value was 9, you would need to find 6 + ¼ (9-6) = 6.75.)
For the Upper quartile we could find either the ¾ (n+1)th value or use the lower quartile position, but start at the highest value and go backwards!
The mode is the item with the most occurrences. In this case we have two lots of 23 two lots of 54 and three lots of 65, so 65 is the modal value.
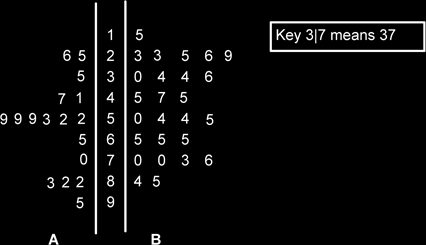
Can we calculate the mean? Yes, but only by adding up all the values and dividing by 23. Some datasets can be awkward to put into a stem and leaf plot. We can also put leaves on both sides of the stem if we have two datasets to compare.
Also be aware that we can use a stem & leaf to plot two datasets at once, with one group going to the left and the other to the right.
Stem and leaf diagrams are okay if the data has nice values, but if the data is something like 24, 305, 87 2.6, then it isn’t really feasible to make the stem and leaf work properly.