| Home | Revision | GCSE | Statistics | Misleading Graphs |
Misleading Graphs
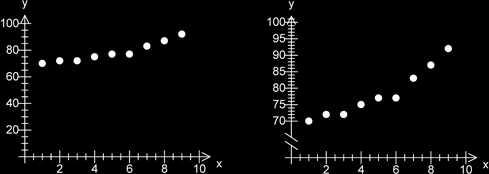
It is possible to convey false impressions. By changing the scale of the vertical axis one can exaggerate an increase (say in sales) or minimise a decrease (say in loss). Note the graph on the right gives a better impression of increasing sales.