| Home | Revision | GCSE | Statistics | Grouped Discrete Data Cumulative Frequency Polygon |
Grouped Discrete Data Cumulative Frequency Polygon
What should we do, if our discrete data is grouped into class intervals. Well, because it is possible to interpolate values within a class interval, our diagram should allow this. We therefore join up our plotted points with a straight line (not a step) to get a cumulative frequency polygon. However we plot as our horizontal point the upper bound of the class interval. In this case for the first one, our upper bound is 5.5, because all values are less than this. Of course, it may be impractical to plot to such accuracy if our scale is too fine for the class interval.
| No. of words per sentence | Frequency | Cumulative Frequency | How it is calculated | |
|---|---|---|---|---|
| 0-5 | 14 | < 5.5 | 14 | = 14 |
| 6-10 | 17 | < 10.5 | 31 | = 14+17 |
| 11-15 | 6 | < 15 | 37 | = 14+17+6 |
| 16-20 | 8 | < 20 | 45 | = 14+17+6+8 |
| 21-25 | 3 | < 25 | 48 | = 14+17+6+8+3 |
| 26-30 | 2 | < 30 | 50 | = 14+17+6+8+3+2 |
| Total | 50 |
What this table is saying is that we have 14 sentences that had less than or equal to 5 words, 31 sentences that had less than or equal to 10 words, and so on. We can now plot a cumulative frequency polygon for this grouped discrete data.
Note that the points are drawn at the horizontal points 5, 10, 15 etc., this is where we are saying that we have so many sentences less than or equal to that number. We have drawn in a point at zero, because we can say with certainty that there are no sentences with no words in. Using the origin may not always be allowable like this. It depends upon the context.
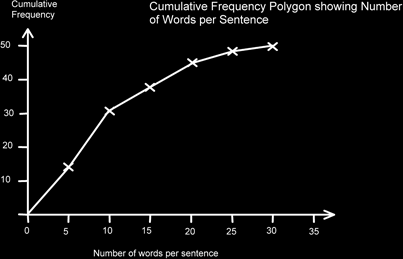
We have also connected the points with straight lines as a polygon. This is because the data is discrete data. Note also, that unlike a bar chart for discrete data, the horizontal axis is a scale, not labels.
We can use this graph to estimate the median and quartile points in a similar manner to before. The half-way point will be at 25 and the quartiles Q1, Q3 at 12.5 and 37.5 respectively. (Again, if n were smaller we might have to use ½(n+1) rather than a ½n etc.)
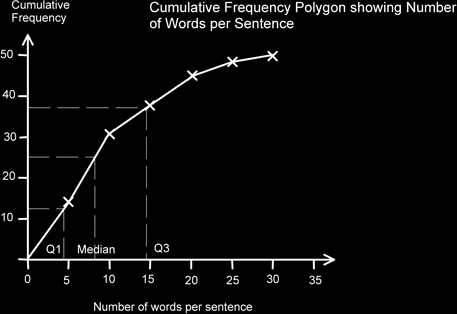
So the median is 7.5, Q1 is4.5 and Q3 is 14.5 (as well as I can judge on this scale anyway). The Interquartile range is 14.5-4.5 = 10.