| Home | Revision | GCSE | Statistics | Cumulative Frequency Step Polygon For Simple Discrete Data |
Cumulative Frequency Step Polygon For Simple Discrete Data
Consider we count the number of goals per football match from the group stages at a major competition.
We add an extra column to the frequency table called the Cumulative Frequency column. Into this column we start off with the first frequency, i.e. 6. We then add to this the number in the next frequency column. i.e. 6 + 15 = 21. Then we add the 8 to this total to get 21+8 = 29 and so on.
What this gives us is the total number of items equal to or less than the number of Goals/Match.
So there were 37 matches where the total number of goals was equal to, or less than 3.
| Number of Goals/Match | Frequency | Cumulative Frequency |
|---|---|---|
| 0 | 6 | 6 |
| 1 | 15 | 21 |
| 2 | 8 | 29 |
| 3 | 8 | 37 |
| 4 | 8 | 45 |
| 5 | 2 | 47 |
| 6 | 2 | 49 |
| 7 | 1 | 50 |
| Total | 50 |
What this does is allow us to find out in which class the half-way point of the data values were. Half of 50 is 25. This occurs in the 2 goals/match class.
The point where this happens is the median. So the median value occurs in the 2 goals/match class. Half of the values are less than this, half the values are more than this point.
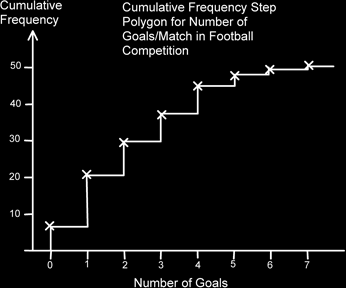
Now we plot the points and from each point we draw a step, down to the next point.
In order to find the median value we look at the total number of values we have. In this case there were 50 matches played. We add one to this then we then half this, to get 25.5 and from the cumulative frequency axis (the vertical axis) we draw a line across to the steps and then down. If the number of items is large enough we can simply use ½n rather than ½(n+1).
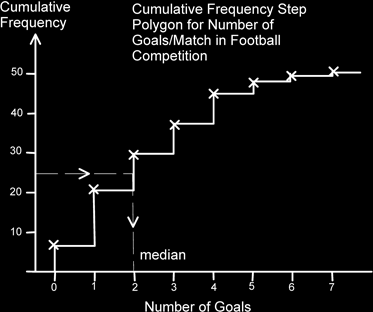
The median value is thus 2 goals/match.
We can also find the lower and upper quartiles (or Q1 and Q3). Really we should find the ¼ (n+1)th and the ¾ (n+1)th values, but since in this case n is quite large we can just use the ¼ n and ¾ n values without losing too much accuracy.
We half the value of the median to get 12.5 and from this point on the vertical cumulative frequency axis we go across and down. This gives the lower quartile. For the upper quartile, we can add the half value and this quarter value (to get 37.5) and also go across and down to get the upper quartile.
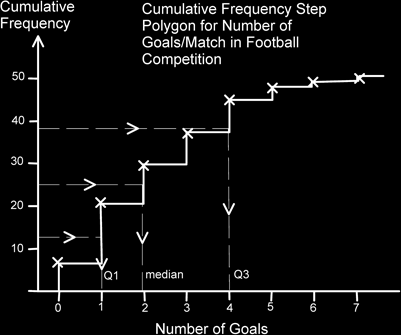
Q1 is 1 goal/match and Q3 is 4 goals/match. The Interquartile range is therefore 4 – 1 = 3 goals per match.