| Home | Revision | A-Level | Economics | Theory of Production & Costs | The different possible.. |
The different possible market conditions
The theory of the firm covers perfect competition, imperfect (or monopolistic) competition, and monopoly. These are increasingly less competitive in the order listed. Oligopoly is considered to be something of a special case.
The Arrow of Competition:

As just pointed out, all firm diagrams start the same way!
The equilibrium position is where marginal cost = marginal revenue!
Why? Logic! If a firm is profit maximising, it continues an action, like expanding output, until it costs more to do it than it brings in as revenue. As long as revenue exceeds costs, it pays to go on doing it. As an example, if total revenue is £2,000 and output is such that the last unit sold increased costs by only £1,500 it clearly added
£500 to revenue more than it cost to build and was worth doing. And another unit might add £1,900 to costs but sold for £2,000 so was also worth it. The next unit, however, might add £2,050 to costs but bring in £2,000 – a loss of £50 so it would not be worth it. When the last unit just adds £2,000 to costs and brings in an extra £2,000 it is marginal – it makes no difference if we produce that last one or not.
So what do we know?
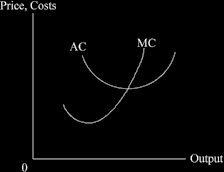
The cost at the margin (the addition to total cost from the last unit produced)
increases as production rises (the MC curve).
The revenue from the last unit sold is the marginal revenue (MR).
Logic tells us that the firm will continue expanding output and watching MC rise until it equals what the firm receives from the marginal unit sold (MR). Therefore when MC = MR it is the best the firm can do, so it stops there; it is in equilibrium.
We use the MC curve to trace what happens if a firm changes its output level, for that very reason.