| Home | Revision | A-Level | Economics | Theory of Production & Costs | Game theory |
Game theory
This was developed to show what happens in a situation where when one firm makes a decision, it has to consider the possible reactions of others to that decision.
Game theory is particularly useful in the oligopoly area where the reactions of others are central.
“The Prisoner’s Dilemma” is a nice model which shows that competition can sometimes be bad, but cooperation can be good. Here is an example.
Two men, Arnold and Brian (i.e., A and B), are arrested for robbery with violence and interrogated separately.
The police say to each that we are certain that we can get a conviction, but:
If neither of you confesses each will be charged with robbery and will definitely get twelve months in jail.
If you both confess then you will each get eighteen months.
But if you alone confess, you will be let off with a caution but the other will get three years in jail. Now, can you trust your friend? If he confesses and you don’t, you will be eating a lot of porridge. Why not confess now?
A problem!
It is tempting for Arnold to confess and hope that the other doesn’t! Then A gets let off scot-free.
But if both confess, Arnold knows he will get eighteen months!
If he refuses to confess, he will get twelve months in jail if the other keeps quiet –
but he will get three years jail if the other confesses!
Clearly both are better off if neither confesses (eighteen months each).
But for either alone the “dominant strategy” (roughly the best bet) is to confess
(because he gets let off free if other does not confess).
However, if he does not confess but the other does it means the full three years! So each is really pressured to confess even although it is better for both the accused if neither does!
What can we learn from the Prisoner’s Dilemma?
Collusion would solve the problem! If the two involved could discuss it and agree, neither would confess! Both would gain the most that way.
And collusion is common in oligopoly!
Price wars with oligopoly:
If there are two firms, it is best if neither starts a price war – if they co-operate and keep the price high, that is as good as it gets.
Let’s think of an example. Assume that currently each sells 10 units at £4 each, so total revenue is £40 for each firm or £80 in total. But if firm A cuts his price to £3 he hopes to sell, say, 17 units at £3 and his total revenue would then be £51, a distinct improvement. The other would of course be able to sell fewer items. Possibly he might be able to sell 4 units or so at the unchanged price of £4, so that his total revenue would be $12 with much reduced profits.
The total revenue of both together is $51 + $ 12 = $63 (and remember it was previously $80!) As a pair they are losing out, even if one does better.
Then B might respond: it is tempting for B to cut his price perhaps to £2.50 and hope to sell a lot more.
This process might continue with both firms cutting prices in turn, and both losing out even more. Game theory suggests they would be better off to collude and go back to the original situation of a price of $4 each and total revenues of $80 for the two, or
$40 each!
4.11 OLIGOPOLY - THE KINKED DEMAND CURVE
The concept was invented to describe the observed stickiness in prices under oligopoly, i.e., to answer the question “Under oligopoly, why do prices alter infrequently?”
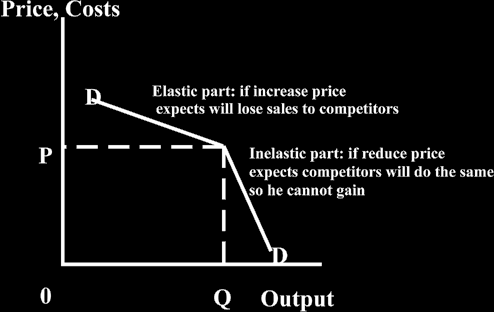
The theory was developed that when an oligopolist had already set a price, he was reluctant to change it. He felt that if he increased his price, he would lose business to his rivals and competitors (who would make no changes in their price) and so profits would fall. However, he felt that if he lowered price to in- crease his sales, his competitors would follow suit, reducing their prices also, so he would not be any bet- ter off. Indeed selling at a lower price, his profits would fall. So if a price rise or a price reduction could easily reduce his profits, he would do neither. Hence the price would remain unchanged for long periods.
If we put this in graphical form, we can see that we start at his current price, chosen randomly in the dia- gram, and look at what he expects to happen if he alters his price.
1. He feels that a price increase would lower profits. This would happen if the good faces an elastic demand. So above his existing price we see an elastic demand curve.
2. He feels that a price reduction would lower profits. This happens if the good faces an inelastic de- mand. So below his existing price, we see an inelastic demand curve.
If we draw this, we observe the following.
The marginal revenue is the addition to profit from the marginal unit sold (commonly seen as the last unit sold). As price is reduced, the marginal unit sells for less than the previous unit sold – indeed for less than all the previous units sold. So the firm loses revenue from all the earlier units as well as the current one. For this reason, marginal revenue is always below the demand curve but they both start together on the very first unit sold. (When the first unit is sold at the price £X, the addition to total revenue is also £X). The marginal revenue curve falls faster than price because of the loss on all the earlier units, once the price of the marginal unit is reduced.
If we put in the marginal revenue curve and a couple of marginal revenue curves, we see the follow- ing.
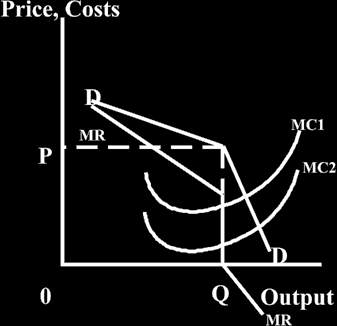
The maximum profit point is where the marginal cost equals marginal revenue. If we start with MC1 we see the MC curve cuts the MR curve in the vertical part and price will be P (reading off the demand curve
– the curve that relates quantity to price).
If costs fall to MC2, the price remains the same, P, because we MC2 still cuts the vertical part of the MR
curve, so the optimum quantity and price is unchanged.
This means that price does not alter much, because if we move the marginal cost curve up or down from wherever it is, it always cuts the marginal revenue curve in the vertical part on the kinked demand curve.
Hence we see sticky prices under conditions of oligopoly - according to the theory of the kinked demand curve.
Criticisms of the Kinked Demand Curve
It does not explain why the price is where it is! This is a major hole in the kinked demand curve as a general theory as it only shows us why price does not alter much. In its defence, it was not de- signed to be a general theory.
In the real world, price changes seem more common than the kinked demand curve theory sug- gests that it should be. Prices do alter!
The theory may be more beloved of examiners (many of whom like setting it) than a realistic description of the world. After all, the firm can always try to increase or reduce price and see what happens!
If it gains, good; if it does not gain it can go back to the original price. This is an easy theory to test for
the firm so there is no reason to think the owner just sits there and worries that he would lose if he chang- es his price.
4.12 REGULATORY CAPTURE
What is it?
It is part of “the economics of regulation”. We are aware that some leading members in industry and
commerce, left to their own devices, are likely to behave in ways of which society disapproves. In the absence of regulation and inspection, some members will engage in price fixing and collusion, bribery of government officials, lie to customers, break various laws, such as dumping waste produce in National Parks, and the like.
What does society do to try to protect itself and the general public?
The government frequently establishes one or more regulatory bodies to oversee the industry and try to control it, in order to protect society as a whole.
What often happens?
The body in charge gets taken over by various vested interests until the regulatory body eventually starts to work for the vested interests and ceases to protect society. In other words, there has been “Regulatory capture”. In a less extreme form, the regulatory body may not be entirely taken over, but a cosy relation- ship between the body and the industry tends to build up over time so the policing powers become weak. There is always the risk of total capture but many economists feel that this extreme position is perhaps not all that common.
How can the body be influenced or captured in this way?
· The industry is likely to have a lot more money than the government body and so can hire more and better staff.
· The regulatory body frequently consists of members who have several jobs or advisory positions, and can devote only limited time to the work of the body. The industry, by contrast, can employ full-time workers to try to present a better case and improve the position of the industry.
· The industry can pay for “research” that demonstrates what a good bunch they are and how well they behave.
· The industry can lobby individual Members of Parliament (and offer inducements for support, some of them not entirely legal).
· The industry can plant articles in newspapers and elsewhere that support their case.
· The appointments to the regulatory body are often top civil servants who know and have worked with leading members of the industry and so have already developed a friendly relationship.
Examples
· It has been alleged (NB I suggest you ALWAYS put in this phrase when you are writing about the
issue in public; it can protect you from being sued by powerful people!) the UK government’s
Medicines and Healthcare Products Regulatory Agency is effectively promoting the pharmaceuti-
cal industry in its efforts to sell drugs and increase profits, rather than protecting the public and helping to keep down the drugs bill of the National Health Service..
· It has been alleged that the Food Standards Agency does not work hard to stamp out additives to foods that might be dangerous to children, including some that promote hyper-activity and poor learning. It is suggested that the Agency tends to pass the buck to the equivalent European body, as well as to the parents of the children, rather than act to improve things themselves.
What might be done to improve the situation and break the cosy relationship between a regulatory agency and the people it is supposed to police?
It might be possible to:
· Insist that all appointees to a regulatory body are approved by, say, a Parliamentary committee.
· Not to allow top civil servants to leave and join the industry (e.g., when they retire) until, say, 4 years have elapsed.
· Regularly change the members of the regulatory body, to prevent cosy relationships developing.
· Not allow inspections of companies in the industry by single inspectors but insist on at least two, in order to make offers of bribes or other inducements more difficult.
· Rotate the teams of inspectors, so that on each visit the industry has to deal with new people.
· Protect whistle blowers – people who reveal what is actually going on. Experience suggests that whistle blowers regularly do badly once they have revealed an unpalatable truth; they are infre- quently promoted; they are often given poor references should they leave; and their names might even appear on secret blacklists.
Names associated – you can quote the names in exam answers
· Adam Smith in the Wealth of Nations was the first to point out that when business people meet up they tend to collude to raise prices.
· Richard Posner, at the University of Chicago, is a main name in the regulatory capture debate. He argued that regulation is not really about serving the public interest (although it should be) but the process actually serves the interests of many, all of whom seek to promote their private interests.