| Home | Revision | A-Level | Economics | Theory of Production & Costs | Cost curves |
Cost curves
Some definitions:
Total Cost is what it says – total costs are all the costs of the firm (fixed + variable)
Fixed Costs are fixed, irrespective of output; they do not increase as output increases. Examples are the salaries of the managerial staff, the interest paid to the bank on the money borrowed, or the local council tax.
Variable Costs alter as output changes. Examples include the need to hire more labour to increase production; and using more raw materials to go into the extra output. Clearly the variable costs must rise as output increases.
Average cost is the total cost divided by output.
Marginal cost is the addition to total cost from producing the last unit of output [or one more unit – it is at the margin.]
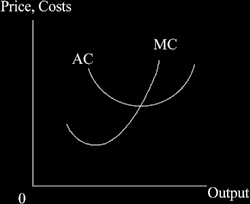
For all the theory of the firm, and all market conditions, the AC and MC curves look the same – you can always start by drawing the AC and MC CURVES without even thinking!
Why are the shapes that way?
When MC is below AC it pulls it down; when MC is above AC it pulls it up. This means that the MC curve must cut the AC curve at the lowest point.
The AC curve is U-shaped because when starting to produce, the fixed costs must be born by a few units of output, so average costs must be high; as the firm produces more, the fixed costs are spread over more units of output, so AC falls. Then it reaches a minimum. Eventually the firm is trying to produce more than it was designed for, and average costs start to rise.
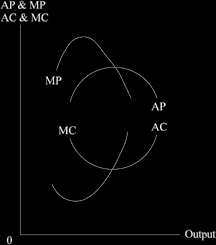
We can depict this as the mirror image of average and marginal products – as physical output increases so costs fall, but as average product and marginal product fall, so costs must rise.
Occasionally there might be a question in an exam asking about the relationship between the two.