| Home | Revision | A-Level | Economics | Why Markets Can Fail | The distribution of income and.. |
The distribution of income and wealth
The demand curves we see in the economy are for the given distribution of income and wealth in that economy. If we were to change the distribution of income or wealth, we could expect to see a different set of demand curves.
For example, if London were to suddenly gain all the income and wealth in the country, everyone outside that city would reduce their consumption of almost everything and do so quickly. They would have no income and have only limited savings to draw on. So the demand curves for many goods and services would alter.
We can imagine that if all the income in the UK were to be redistributed so that everyone had exactly the same income, it would be insufficient per person to buy Porsche or Rolls Royce motor cars, or indeed many luxury goods and services. The demand for these would diminish sharply or perhaps even cease to exist.
This means that unless we have a “good”, “proper”, “desirable” or “acceptable” distribution of income and wealth, then the market will provide a less than satisfactory result! It merely reflects the existing income distribution and not what would make everyone better off. Only if we can all agree that the current income distribution is “the best”, will the market distribute according to what people need rather than have the money to buy (remember, demand means “effective demand”, that is, backed by money, and it is not merely a need). Every time we change the distribution of
income, we change the pattern of demand.
Note that as time passes the economy grows, and some sectors and people do better than others, so the pattern of demand is in fact constantly changing. Other factors that can change demand include new technological goods (mobile phones, scanners…); new goods generally; advertising; weather changes; and new tastes or fashion.
Measuring the distribution of income
The Lorenz curve
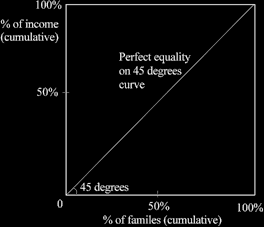
We can show the degree of inequality in income distribution in a diagram. If 10 per cent of families have 10 per cent of the income, and 20 per cent have 20 per cent, and so on, we have perfect equality.
The Lorenz curve shows the actual difference from the 45 degree line of perfect equality. We can actually see the inequality gap in the diagram below!
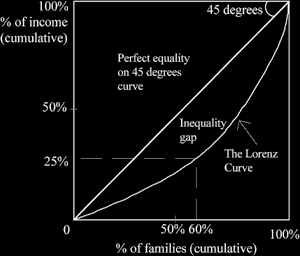
Here, we see that about 60% of the families have only 25% of the income.
The Gini Coefficient
The Gini Coefficient is a more accurate measure than the Lorenz curve - and frankly it is much easier to compare numbers than pictures!
The Gini Coefficient measures the degree of inequality by using numbers – it is calculated as:
Area between diagonal line and Lorenz curve
Triangular area under diagonal line
i.e., this is the inequality gap in the diagram above as a proportion of the whole bottom triangle. The bigger the inequality gap, the closer it gets to the whole; eventually it is the same as the whole and a number divided by the same number always equals one. So the higher the Gini coefficient, the less equal is the distribution of income.
Perfect equality = 0.0
Perfect inequality = 1.0
When the Gini Coefficient equals zero we have perfect equality
Some actual Gini Coefficient figures for three countries
| 1980 | 1994 | |
|---|---|---|
| UK | 0.327 | 0.345 |
| Spain | 0.397 | 0.340 |
| France | 0.417 | 0.290 |
Using these figures, rather than trying to compare by eye some three separate diagrams, we can now compare easily.
We can see that:
• In 1980, the income distribution in the UK is more equal than in Spain.
• The UK’s income distribution got less equal (under the Thatcher government).
• Spain’s income distribution got more equal over the period.
• By 1994, Spain had a more equal income distribution than the UK.
• And France, which in 1980 had less equality, is revealed to have a more equal income distribution in 1994 than either of the other two countries!
This is the sort of thing that the Gini coefficient is used for.
Oh! One more thing! Latin America has the highest Gini coefficients of any of the continents in the world (that is, it has the widest income disparities). That might be a useful statement you could make.
The Gini Coefficient can easily be set in exams, either as an essay or as data response.