| Home | Revision | A-Level | Economics | Why Markets Can Fail | Price fixing by government or.. |
Price fixing by government or one of its bodies
The government might decide that the prices determined by the market are too high or too low and may wish to intervene and change them.
When some institution fixes a price other than at equilibrium, logically it must be either:
a) Maximum price fixing, or
b) Minimum price fixing.
a) Maximum price fixing
When fixing a maximum price, it is always set below the equilibrium level. Q. Why?
A. There is no point setting a maximum of say £1 million for the price of a loaf of bread
– it would have no effect! It is always less than that anyway.
When someone sets an effective maximum price we always see the same result: Demand will exceed supply at the set price. We did this in an earlier diagram but we
will do it again now.
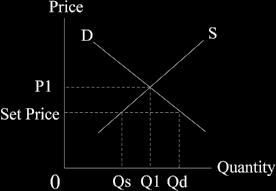
With this maximum price fixing we have an excess demand of OQd – OQs (which is the distance Qs to Qd).
Therefore we can expect to see:
• shortages.
• black markets emerging.
• possibly rationing will be introduced.
• corruption might arise.
In the rental housing market if there is “rent control”:
• “key money” might be demanded, a bribe in order to be able to rent the cheap house; or
• a silly bet can be made which is deliberately lost, just to hand over money; or
• the person renting has to purchase the fixtures and fittings at an extremely high price; or
• perhaps sexual favours will be demanded before the owner will rent to a person.
In other markets, such as for meat in war time, there will be shortages and queues (=
rationing by time) until a rationing system is introduced by government.
b) Minimum price fixing:
Minimum price fixing may occur with agricultural products in rich countries, where the government tries to help its farmers by giving them a larger income.
It may also be encountered in primary produce in the third world, with marketing schemes and buffer stocks.
The same results always emerge: the quantity demanded is less than the quantity supplied at the prevailing price,
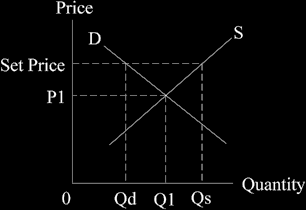
With this minimum price fixing at “Set Price”, above the equilibrium level of P1, we see a surplus of OQs minus OQd, or the gap Qd to Qs.
And we can also expect to observe:
• storage problems and high storage costs (agricultural produce is like that!);
• the spoilage rate likely to be high (agricultural produce);
• there may be dumping of some of the produce in the sea; or
• selling part of it below cost to countries abroad.
The surplus will continue to grow each year as long as the minimum price persists above the equilibrium one, so the problem (and storage costs) keep on increasing.
Primary produce marketing schemes
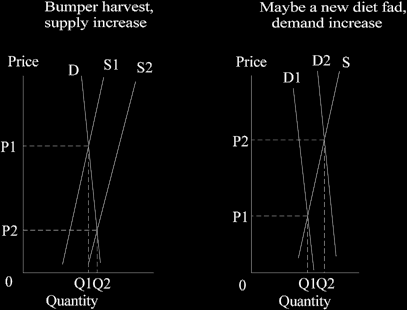
Primary produce is prone to large fluctuations in price, the result of both demand and supply being relatively inelastic, so that a change in either alters price quite considerably.
Supply is likely to alter sharply for all agricultural crops, as the harvest can be poor or a bumper one, depending on the weather.
Demand is likely to alter sharply for things like rubber if there is a slump in the motor vehicle industry so that fewer tyres are required.
So if we look at a diagram of inelastic supply and demand and alter either, price will rise or fall substantially.
Remember to draw the curves very steeply – they are very inelastic and the steep slope gives us the large price alterations.
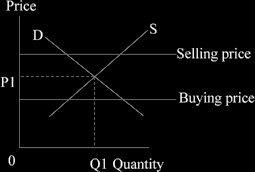
As a result of the wide price fluctuations, it is tempting to set up a marketing scheme, which can buy when prices are low and sell when prices are high, thus stabilising the price. A “buying price” and “selling price” are set by the marketing board and all should be well. This is how it looks (the curves would be much steeper; I have drawn them flatter so you can see what is happening more easily):
However, there is a major problem! Unless the board guesses the long term price it will set the buying and selling prices incorrectly. If the board buys at a relatively high price, it will run out of money rapidly. If it sells at a relatively high price, it will end up with stocks of the produce that cannot be sold.
In the worst scenario it would look something like this in the diagram below:
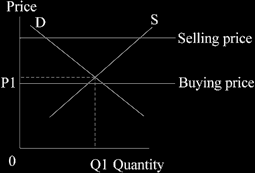
You can see that the excess supply is great at the selling price, but there is little excess demand at the lower buying price. So stocks must build up as supply permanently exceeds demand.
Typically this happens, for the board normally also wishes to increase the incomes of the farmers a bit so that when setting the prices it tends to err on the generous side.
Does this sort of thing occur in the real world? Yes it does! Cocoa, coffee, rubber, sugar and tin have all had such boards and suffered problems with them, including attempts by the boards to raise the long term price by restricting supply.
NOTE: all price fixing brings problems in its wake, even if the intentions are good!
Economists generally favour free markets for this reason. If there are particular problems, like pockets of poverty, it is usually better to tackle them directly rather than try to fix the price of the product for all – which includes the rich and the poor.
Price fixing can also be found in labour markets where the government tries to help the lowly paid by setting a minimum wage.
As economic analysis predicts, problems will emerge. In the case of labour, we would see unemployment at the prevailing wage rate. There might also be kickbacks and bribes by workers to get one of the few jobs available. Marlon Brando in the movie “On the Waterfront” was involved in such a process – it’s an old film but worth seeing!
That is not to say that we should never have a minimum wage and the benefits (a minimum income, preventing the exploitation of the poor and needy by unscrupulous employers, and generally feeling that a wealthy society can afford to be slightly generous to those at the bottom) may be worth the problems.
What are the problems of setting a minimum wage?
When the government legislates for a national minimum wage, it does not affect all industries and firms. Many are already paying well above the minimum, in order to attract the right kind and quantity of workers. So minimum wage legislation only impinges on lowly paid jobs in some industries, as in firm C in the diagram below.
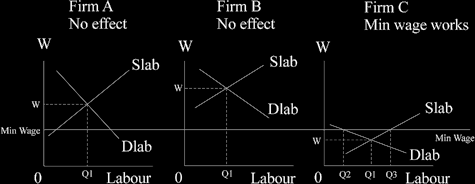
Firms A and B might be city banks, and C might be a small local café for example.
Where minimum wage legislation is effective, as in firm C, we see that after the imposition of a minimum wage, fewer people will be employed. The numbers fall from OQ1 to OQ2, a reduction of Q1-Q2. We will also observe unemployment in such firms, as the number offering themselves for work is OQ3, reading off the supply curve, but the number that are employed is only OQ2. Unemployment is represented by the distance Q2-Q3 in the above diagram. Those who find a job in such firms now enjoy a higher income, but fewer can actually find a job than earlier and conspicuous unemployment emerges. It is the usual problem of excess supply at the higher minimum price or wage.