| Home | Revision | A-Level | Economics | How Markets Work | The market mechanism working |
The market mechanism working
In a perfect world, a market system will give a perfect result - resources will be allocated exactly to where people need them to produce what the people demand.
Think supply and demand curves for two goods, both in equilibrium; assume people spend all their money (as this is easier to imagine how it works). Then increase the demand for one good (which means you must reduce demand for the other, because they are spending all their money by assumption).
First we look at the goods market - let’s assume they are bread and milk; we start in equilibrium, then we will increase the demand for one good and see what happens.
Secondly, we examine the factor market which lies below the goods market. That consists of those resources that are used to produce the bread and milk. We use the labour market as the factor of production.
We have simplified the model by using two goods and one factor to show the perfect workings of the market. With any number of goods and services and more factors we can still get this perfect resource allocation.
(The whole of Unit One in this course is devoted to this market solution. Unit Two will explain why we may not in fact attain this theoretical perfection.)
Abbreviations used: MC = marginal cost
AC = average cost
P = price
Q = quantity
MR = marginal revenue
Lab = labour
AR = average revenue
PPC = production possibility curve (production frontier)
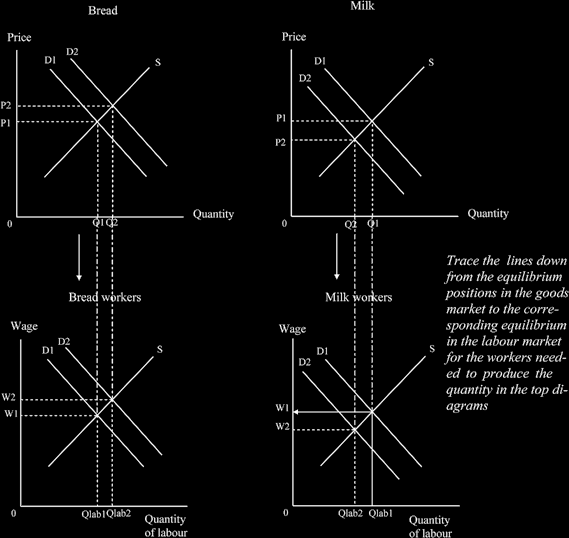
We start with the market for goods or services (bread and milk) in equilibrium
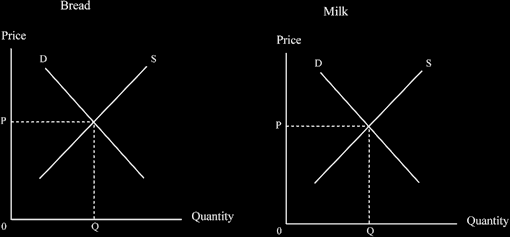
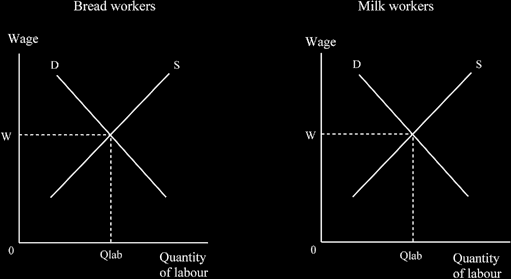
And we can also examine the factor market for these goods; in this case we will use the people who make the bread and produce the milk (Unit 4 covers labour markets in detail). Again we start in equilibrium. (The two diagrams below do not have to look exactly the same as the two above; they just have to be normal supply and demand curves.)
THEN, WE CHANGE SOMETHING AND ALTER THE EQUILIBRIUM POSITIONS
let’s increase the demand for bread and reduce the demand for milk. (On the assumption that all in- come is spent, if people spend more on bread they must spend less on milk.) We start as usual in equi- librium, on the demand curve for bread, “D1” and increase it to “D2”. People switch to consuming more bread and away from milk, so the demand for milk falls, from D1 to D2.
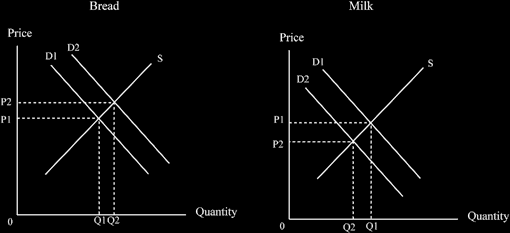
You can see on the left that the price of bread rises (people demand it more) and on the right the price of milk falls (less demand).
Because of this change in the demand pattern, we get an increase in the demand for workers to produce more bread and a fall in the demand for milk workers - and we will reach a new equilibrium in the factor market.
Again, demand increases from “D” to “D1” for the bread workers, and falls from “D” to “D1” for the milk workers.
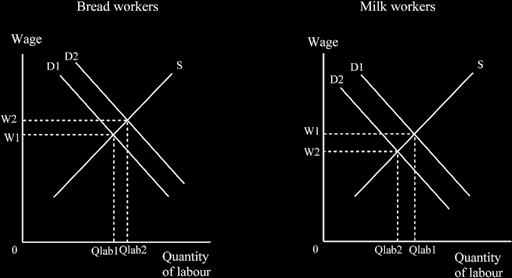
You can see on the right that wages rise where demand for the product has increased (bread), and on the left they fall where the product is less in demand than previously (milk).
We can put changes in goods/services market and factor markets together into one diagram, one directly above the other and read it vertically to see what happens to the factors of production in both industries as demand changes.
We see, as the demand for a good or service increases (top left hand side), this sucks factors into that industry - but where do they come from?
They come from the contracting industry, where the demand for a good or service has decreased (top right hand side) - the factors of production (land, capital and workers) have to leave that industry (in the real world, if unemployment already existed, some of the unemployed might be drawn into work).
Where demand for a good or service falls, the workers might simply be dismissed - which really annoys
people, upsets the trade unions, and might have a political fallout with loss of support for the government.
Or the firms may take advantage of “natural wastage”; that is to say that is to say, as people voluntarily leave, they are not replaced.
Who leaves? Several groups may be involved:
· old workers who are retiring because of age
· those who get ill and retire
· those resigning and moving to a better job as part of a career move
· those who move to a new area of the country, following their spouse, to get to a better climate or school area for instance
· those who migrate to a different country
· those who die
Unemployed people are naturally very upset and social problems can emerge which the government may have to deal with. But with capital, e.g., trucks, or warehousing facilities, shifting the use of these causes little upset - things have no feelings! They may be sold or leased to other companies to use.
Land is similar to capital, it can often be transferred to several other uses fairly easily.
The above diagrams of resources moving from declining sectors to expanding ones and stopping in equilibrium demonstrate the way the market mechanism (price mechanism) operates.
This was first spotted by Adam Smith in the Wealth of Nations as early as 1776 although the diagrams did not come until later. Understanding how an economic system works in this fashion led to the phrase “the consumer is king” as the next sentence explains.
Resources (land, labour and capital) flow from where they are not in demand, or demand is falling, to where they are in demand, or demand is rising. So the price mechanism is well-regarded as a good (but by no means perfect) way of allocating resources to society’s demands.
Later, in Unit 2 “Why markets fail” you will learn what can, and actually does, go wrong with this apparently brilliant market system.
A reminder: are you revising something and practising drawing a few diagrams each day?