| Home | Revision | A-Level | Economics | How Markets Work | The elasticity of demand |
The elasticity of demand
ELASTICITIES
Elasticities are a sort of measure of supply and demand.
If demand increases, and we ask how much does supply extend, we need more than an answer like "quite a lot"!! Government may be trying to raise tax to get a certain amount of revenue for instance. The question is “How much will quantity change, a lot or a little?”
WE START WITH THE ELASTICITY OF DEMAND
Three broad types of elasticity of demand
1. Price elasticity = the usual one, it deals with 1 good.
2. Cross elasticity = a special one, it deals with 2 goods.
3. Income elasticity = a special one and it deals with changes in incomes.
1. Price Elasticity of Demand
Definition: "Price elasticity of demand is a measure of the responsiveness of the quantity demanded to a small change in price". Learn this by heart!
[In simpler terms, “is the proportional change in quantity greater or lesser than the change in price?”
As an example, if the price was 20 and it falls by 2, the fall is 10% (2 times 100, all divided by 20); and if quantity then increases from 100 to 200, the increase is 100%.
We can see that the increase in Q is greater (100% compared with 10%) - i.e., it stretches out a lot - it is elastic!]
How do we actually measure price elasticity?
Price elasticity of demand is measured by the percentage change in Qd, divided by the percentage change in price:
%∆Qd / %∆P
So the price elasticity of demand is:
[∆Q/Q] / [∆P/P]
→ ∆Q/Q x P/∆P (to divide by fraction invert and multiply)
→ ∆Q/∆P x Q/P (gathering the change terms all on side for neatness. If this shuffling makes you unhappy, just remember that 3 x 4 is the same as 4 x 3)
In the example above, the percentage change in Q was 100 and the percentage change in price was 10 so the elasticity is 100 divided by 10 = 10.0 In the world in which we live this is actually very high! (Anything over 2 in the real world is pretty high.)
Logically the answer can have only 1 of 3 results: <1, = 1, or >1
(< stands for “less than”; > stands for “more than”; if we are looking at “<” left to right, the way we read, we see it goes little to big so it is easy to remember!)
When we look at the fraction, we find that the answer is less than 1 if the top is smaller than the bottom, equal to 1 if the top and bottom are the same, or more than 1 if the top is greater than the bottom.
What does each possible answer mean?
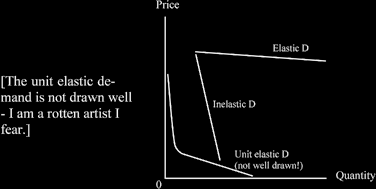
a] If the answer is greater than 1 (e.g., 1.62) the demand curve is elastic.
It means that a small change in price led to big change in quantity (Q stretched a lot which means that it is elastic); graphically the curve tends to look flat when compared with an inelastic curve. But remember all curves must have the same scale and axis or else be on the same diagram.
Examples of demand curves which are price elastic:
Dell computers (one brand of many substitutes); foreign travel by cheap airlines.
b] If the answer is less than 1, e.g., 0.75, the demand curve is inelastic People do not respond so much to price cuts and although they buy more, they do not buy a lot more.
Examples:
Salt, bread, sets of cutlery (essentials; no substitutes).
c] If the answer just happens to equal 1 it is “unit elastic” (unity = 1), a special case and rarely seen, except perhaps for a small part of a large demand curve! The answer would work out at exactly 1.0 and the curve is asymptotic; this means that it approaches more and more closely but never quite reaches the axes.
Reminder: if you draw one rather flat demand curve in one diagram, demand is actually only relatively elastic etc because we do not know the scale - don’t worry about it, it’s technical! Just remember to say “relatively inelastic” or “relatively elastic” in the exam room! If you draw them on one diagram then you are on safer ground if you just say “elastic”.
What do the different elasticity demand curves look like?
The importance of the elasticity concept
It allows us to get precise answers, not be vague.
We need it for certain questions e.g., if a hairdresser is considering increasing her price for a basic cut from
£20 to £25, will profits rise or fall?
What determines price elasticity?
· The number of substitutes - the greater the substitutes, the more elastic the good - a small price rise means consumers switch to another brand. THIS IS THE MAIN DETERMINANT!
· The proportion of income - the greater the proportion of income going on good, the more elastic it tends to be. Salt is relatively inelastic and very cheap - would you consume a £2’s worth a year?
· Luxuries and necessities - luxuries tend to be more elastic (airfares, foreign travel); necessities more inelastic (electricity). Some economists do not like this “luxuries” point because what constitutes a luxury alters too much and in addition they can be personal to different individuals.
· Time - the longer the time, the more elastic demand tends to be, probably because
· More substitutes become available , the good or service is copied by others, new manufac- turers can enter, imports be made etc.
· Habits change only slowly, so we adjust to new prices slowly.
· Capital may need to wear out to make change, e.g., if the price of petrol rises, drivers have to wait until it is time to buy a new and smaller car in order to reduce petrol consumption.
Q. For the hairdresser earlier who is considering a price rise, I asked earlier what would happen to her profit if she charged more. Assume she is very good and her clients feel that there is no real substitute?
A. The demand curve for her services is inelastic so profit would rise!
Q. But consider what would happen if she were just another high street hair dresser? Draw the diagram for me now!
Another example of the importance of elasticity: if the government raises the tax on cigarettes, will government revenue rise or fall? And by how much?
The government normally wishes to raise more revenue - although there are health benefits if people reduce cigarette consumption, which saves on National Health Service expenditure too.
If the government raises tax by 5% and demand is inelastic, the quantity will fall as price rises, but it will fall by less than 5%, so revenue will increase.
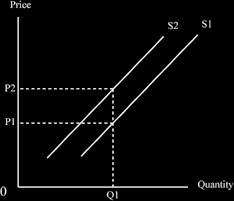
If the government imposes an indirect tax, it pushes up the supply curve by the exact amount of tax.
If the tax is absolute e.g., £1 each item, it pushes the curve up parallel. The original producer faces no change in supply conditions, but £1 is added to each quantity.
When we draw the diagram for the imposition of indirect tax: we start at the original equilibrium, and add the tax.
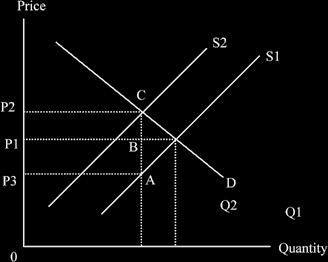
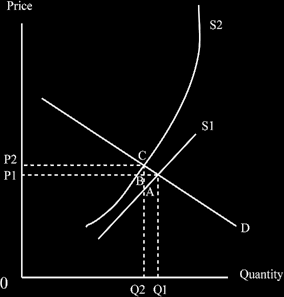
When we look at the market equilibrium, we start with a supply and demand curve and see the original equilibrium. We then add the tax, which pushes up the supply curve and look at the new equilibrium position, to see what changes the tax has made.
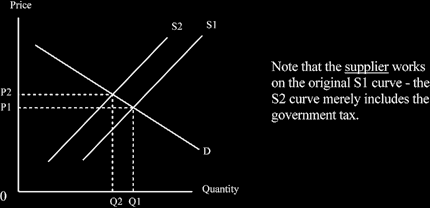
We can see that the original equilibrium position P1Q1 becomes P2Q2 once the tax is imposed. There is a rise in price - but by less than the whole tax - and there is a fall in quantity.
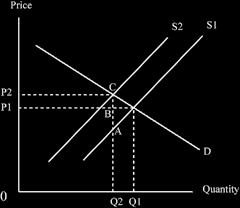
The increase in tax per unit is AC, but the price only goes from P1 to P2 = BC; and BC is less than AC (price rises but by less than the whole amount of tax per unit)
What about the change in government revenue? This is the quantity now sold (OQ2 at the new equilibrium position = the number of units) times the tax per unit (AC). This is the area bounded by P2CAP3 in the diagram below.
If the indirect tax is ad valorem (proportional not absolute, e.g., 10%) it pushes up the supply curve at an increasing rate
Q. Why?
A. Because 10% of £1 is only 10P, but 10% of £10 is £1!
A subsidy is just a negative tax e.g., government gives producer some money (subsidy) rather than a producer or consumer giving money to the government (tax).
Subsidy questions are not usually as interesting as tax ones!
Let’s draw the diagram for putting on a subsidy.
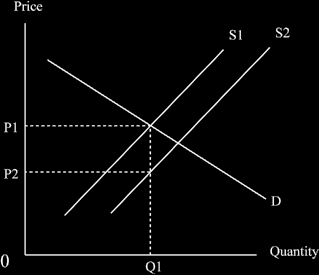
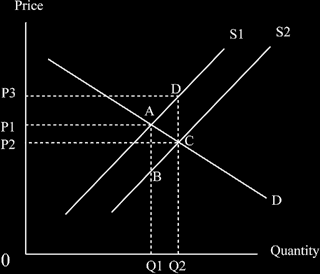
We start, as ever, in the initial equilibrium position, P1Q1 on the curves S1 and D1. The subsidy goes on, the size of it is P1 to P2, and the new supply curve is S2. You can see that the unchanged quantity, Q1, is now cheaper at price P2- but we have not yet examined the new equilibrium position to see the results of the change.
What is the total amount of the subsidy, i.e., the cost to the government? We need to look at the new equilibrium position, which will be at P2Q2, below.
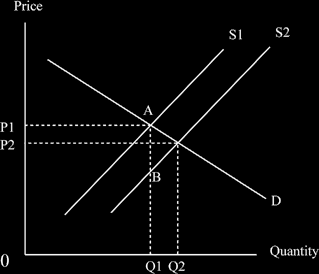
The subsidy is AB for each unit in the diagram above. The quantity sold after the subsidy is imposed is OQ2.
So how much does the subsidy cost the government, and ultimately the tax payer?
The subsidy the government pays is the new quantity sold, (0Q2) times the subsidy amount per unit of
BA.
We know that BA is the same as CD because the curve shifts parallel.
We know that the suppliers continue with curve S1, so they require price 0P3 for quantity 0Q2 (Note that the supplier works off the original supply curve - there has been no change in the determinants of his or her supply.)
We see that consumers pay the rectangle 0Q2CP2.
We see that the government pays the rectangle P2CDP3 - this is the subsidy cost to the tax payer. And together these add up to the total expenditure of 0Q2DP3.
Notice also that consumption rises from 0Q1 to 0Q2 - which is the point of the subsidy: more is pro- duced and consumed.
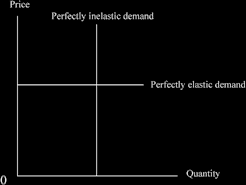
The limits of price elasticity of demand
Perfectly elastic = a horizontal line; this means that consumers will demand an infinite amount at that price! It is merely a limit and obviously it cannot be reached.
Perfectly inelastic = vertical line; this means that consumers will pay any amount at all, such as £1, or £1 million, or £1 trillion…. to buy the good or service. Again this is unreasonable, it’s merely a limit. They look like this:
2. Cross Elasticity of Demand
Definition: "Cross elasticity of demand is a measure of the responsiveness of the quantity demanded of one good or service to a small change in price of another". Learn this! It is virtually the same as the definition of price elasticity earlier - go on, compare them now!
Cross elasticity measures substitutes and complements (note the spelling; it is not “compliments”)
If the supply of beef increases so the equilibrium price falls, it may induce some people to switch from eating chicken or pork to eating the now cheaper beef. The fall in price of beef causes a decrease in quantity demanded of chicken or pork.
%∆Qd of good A / %∆P of good B
Note the “A” and “B” difference: we are dividing the percentage change in the quantity of A by the change in the price of B.
If the price of beef fell and the quantity of chicken fell the answer will be positive, because two negatives make a positive, so any items with a positive cross elasticity are substitutes.
If the price of heating oil falls it may induce some to install oil generated central heating in houses. We see that a fall in the price of A means an increase in the quantity of generators, so the answer is nega- tive (one plus and one minus) so these two goods are complements.
Cross elasticity does not seem to be used much in economics, except in exams.
3. Income Elasticity of Demand
Now this is most important! Incomes keep increasing over time, so the demand pattern for various goods and services keeps changing. This matters for new firms looking to move into the market and produce something: the market for what goods or services is likely to grow the fastest? That’s the area to be in! It matters for existing firms looking to diversify, or be concerned about the prospects for the future in the area they produce and sell in.
Definition: "Income elasticity of demand is a measure of the responsiveness of the quantity demanded of a good or service to a small change in income". Learn!
Income elastic: a given change in income leads to a greater than proportionate increase in demand for the good or service. Examples of income elastic goods: foreign travel, good wines, smart motor cars, eating in restaurants, and currently well-regarded brands, e.g., Adidas sportswear or Rolex watches.
Income inelastic: a given change in income leads to a less than proportionate increase in demand for the good or service. Examples: bread, staple foods generally, cheap stores, and all lowly-regarded brands. If our income happens to double (lucky us!) we do not spend twice as much on such items.
Income neutral elastic: should it just happen that, say, a 5% increase in income leads to a 5% increase in demand for a good or service, then it is income neutral elastic. This is not really an interesting case, merely a bit strange. Oddly enough, Pizza Hut in Australia claimed in the 1990s that they were like this: in a recession some people stopped eating out so stopped going to Pizza Hut, but other people switched from “proper” restaurants to Pizza Hut which cancelled things out, so the company did not suffer!
Income negative elastic: this is most interesting! This happens when an increase in income causes a fall in demand. Really it indicates that we dislike this product but for some reason we must consume it at
the time. When we can afford not to consume it, then we stop buying it. Examiners like this concept!
Examples are scarce, but it is suggested that probably potatoes were like this in Ireland during the Nine- teenth century. Currently, the demand for mealies (sweet corn) in some African countries may be in- come negative elastic. It is a rare event anyway. Negative income elasticity means that it is an “inferior good”.