| Home | Revision | A-Level | Economics | How Markets Work | Demand and supply: Applications to.. |
Demand and supply: Applications to any market are possible
Popular ones that examiners often like to set a question about include:
· Housing
· Foreign exchange
· Agricultural products or raw material production, like tin or coal (often inelastic S and D so fluc- tuations are common)
But the analysis is virtually identical in each case! You need to mention supply and demand very early in your answer and then use supply and demand analysis, drawing the curves you need.
Be prepared to handle:
· The concept of equilibrium
· The determinants of supply and of demand
· An increase in demand and a decrease in demand
· An increase in supply and a decrease in supply
· An extension of both demand and supply
· The elasticity of demand and supply
· Minimum price fixing (examined in Unit 2)
· Maximum price fixing (examined in Unit 2)
· Applying an indirect tax (which shifts S curve up and to right).
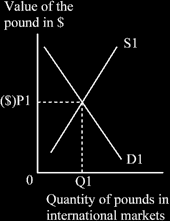
An example of foreign exchange
You must use a diagram or two!
The value of a currency is determined by the supply and demand for it - just like any other good or service, it is the normal equilibrium diagram you need.
The supply of £’s comes from the UK importing goods and services from abroad. We pay in pounds to a bank, which uses them to buy the US $ etc. that we need to pay the foreign supplier. If we import more, we increase the supply of pounds on the market, thus putting pressure on the pound to fall in value. Similarly, if we export, we buy the pounds back, thereby increasing the demand for pounds.
You could usefully practice drawing diagrams to fit these scenarios. They are the standard increase in supply and decrease in supply diagrams, but with “Quantity of £” on the horizontal axis and “Price of £ in $” on the vertical one. We have to value the pound in some other currency, such as US$.
If the UK increases its imports, this puts more pounds on the international markets as we pay for the extra imports. This means an increase in the balance of trade deficit. This increase in supply then puts pressure on the value of the pound, which falls.
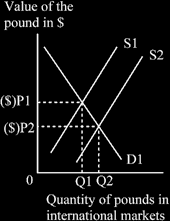
If foreign holders of pounds, largely banks but also others such as large international companies as well as international speculators, decide the pound is overvalued and about to fall, they might sell. The results are the same: the increase in supply reduces the value of the pound. This may be termed “self justifying expectations”.
An example of the labour market.
If the UK allows more migrants in, this increases the supply of labour. Because many migrants are relatively young males, they add to the supply of labour, normally producing more than they take out in social security benefits.
The increase in the supply of labour puts pressure on to lower wages, especially for the unskilled or semi-skilled. It is difficult for many migrants to find more professional work unless their English is good; they tend to end up in the unskilled sector, even if they have skills and abilities, until their lan- guage skill improves sufficiently and this can take many months or years.
The result is the normal diagram for an increase in supply, in this case of labour. You need the quantity of labour on the horizontal axis and wages on the vertical. Go on, draw it now!
Remember! You must use diagrams to answer questions about price or wages. Many markers glance at the diagrams first and if they are correct, he or she is immediately disposed to give you a good mark and a decent pass! If your diagrams are clear and correct, they might also give you the benefit of the doubt if they have trouble with your handwriting or standard of grammatical English. In the exam room in economics it is virtually impossible to get a good mark without diagrams.