| Home | Revision | A-Level | Economics | Managing the Economy | Supply side economics |
Supply side economics
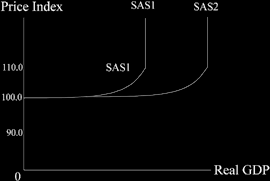
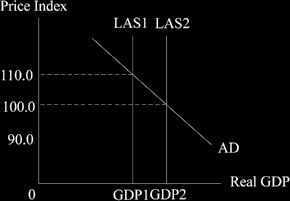
When we are dealing with supply side economics, it is the right hand end of the diagram that matters. There we are at the full employment level of national income (GDP)
Q. What happens if increase aggregate demand?
The result must be that we can only have inflation; no increase in GDP is possible. Draw it yourself and see! We just slide vertically up the unchanged aggregate supply curve.
This means that to gain more output (which would mean a higher standard of living and would be economic growth) we can only move the aggregate supply curve outwards and to the right!
Pushing the vertical line to the right isthe underlaying rate of growth of the economy – it is going naturally much of the time. You will recall that it is one of the main economic goals.
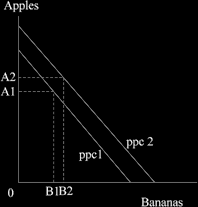
We can also see the growth that occurs by means of the production possibility frontier diagram. Starting on production possibility curve 1 (ppc1) with A1 and B1, we observe that ppc2 shows that we can produce more apples and bananas i.e. more of everything. The actual new equilibrium position is shown as A2B2, with more people preferring apples than bananas.
How can we move the aggregate supply out to the right, as we wish to do?
• More efficient organisation of everything! Better factory layout; better management; better workers (in-house training); reduce management-labour conflicts; increase the flexibility of how and where the firm can use its workers; more flexible wage rates and payment methods.
• More investment.
• New technology.
• Better education and training in society.
• Stronger work motivation among managers and workers.
Generally, it covers all the items that are in the production function (L + N + K) + R
but especially the elements within the “R” term.
SUPPLY SIDE ECONOMICS IN MORE DETAIL
The general views of the supply side school were popular under Prime Minister Thatcher and President Reagan during the 1980s.
1. A central idea was that there is great scope for increasing GDP and economic growth, by concentrating NOT on the demand side but on the long run supply side. As a consequence, policies to push out the aggregate supply curve were in vogue.
2. An attached idea was that there was much latent motivation and incentive to effort that was simply not being used. People were too highly taxed to wish to work harder - so reducing the high levels of income tax would release much creative effort and people would choose to longer hours and/or more intensively while they were at work. In this way the aggregate supply side would be pushed to the right as in the diagram below.
An American economist called Arthur Laffer was associated with developing the supply side view.
He felt that:
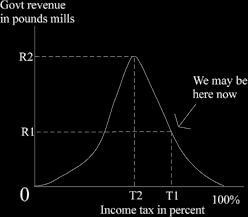
• If income tax were zero the government would get no revenue (they did not ask for any).
• If income tax were 100% the government would get no revenue (because no one would work for nothing).
• So somewhere in between there must be a point that would maximise government revenue.
AND he felt that current levels of income tax were higher than they should be; so if we reduced the level of tax it would increase governmentrevenue .
In the diagram below, if we start somewhere like R1T1, with a high rate of tax T1, the government only receives revenues of R1.
But if we reduce high marginal tax rates, government revenue would increase as we slide up the curve. The maximum government revenue is at R2T2, with lower tax rates and more effort, leading to greater government revenue and of course a higher output. The increase in real GDP is the aggregate supply curve pushing out to the right, which is what we wanted to achieve. It all seemed logical and plausible to many, especially to those in the higher income brackets or with a strong entrepreneurial talent who wished to keep the fruits of their labours.
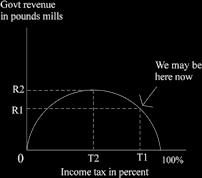
There is no need to think the curve must be symmetrical and some feel it is perhaps more likely to be shaped like the one below. The difference in shape reflects what we assume about how fast people alter their behaviour when faced with high marginal rates of income tax.
3. Supply siders tended to think that monetary policy should be central to government efforts to control and fine tune the economy. Hence fiscal policy should not be used once direct taxation levels have been lowered to stimulate work-effort to the maximum
possible degree.
They understood that changes in taxation worked on the demand side (e.g., if we reduce VAT [a sort of sales tax], people would spend more) but they were supply-siders, and therefore they did not like using the demand side much.
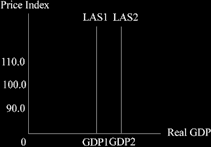
Supply side proponents tend to be a small group and individual members may focus on different things that can push the supply curve out as a solution to the economic problem of gaining long term growth and maintaining a low rate of inflation. Here you can see output increasing and a falling rate of inflation.
The things that can push out the supply curve include:
• Investment.
• New technology.
• Better education and training for workers and management.
• Enthusiasm, incentives, attitudes – with a predilection for tax reductions to motivate people.
• Lower rates of income tax (via mechanism of incentive to work longer or harder).
Although not universally popular, the supply siders reminded us that it is important not to overlook the supply side and that long term growth matters. Tinkering with demand can mislead us into trying quick fixes for the economy, rather than promoting our long term interests.
A reminder: are you revising something and practicing drawing diagrams each day? If not, it isn’t too late – start today!