| Home | Revision | A-Level | Economics | Managing the Economy | Money and monetary policy |
Money and monetary policy
MONEY
Definition: money is anything generally acceptable in payment of a debt. It can be (and has at various times and places been) things like sea shells, cigarettes, or bottles of rum. But these are very rare instances!
The functions of money (= what is it for?):
• A medium of exchange
• A unit of account
• A standard of deferred payment
• A store of value
Classification of money (There are lots: M0-M12 or so)
There are many ways of measuring the money supply – but only two really matter to us.
1. M0 = narrow money = notes, coins and bank balances deposited at the Bank of England; in May 2004 it was £41 billion. M0 had a growth rate of 6.0 per cent over the twelve months to July 2004 (provisional figure).
2. M4 = broad money = M0 + all sterling deposits with banks and similar organisations
(those that the Bank of England allows to take customer deposits); at April 2004 it was
£1,095 billion, that is, it’s much larger than M0. As a result, many observers focus on
M4 as the main one to be looked at. M4 had a growth rate of 9.7 per cent over the twelve months to September 2004 (provisional figure).
[Remember! It is useful to scatter the odd statistic in your exam answers – it can impress the marker that you are interested and aware. That can gain you marks if s/he is uncertain whether you really understand something; it can help you get the benefit of any doubt.]
M4 contains:
• Notes & coins.
• Operational balances at the Bank of England = bankers’ balances = bank deposits at
Bank of England with which each bank can settle its debts to the others.
• Sight deposits = current accounts = no-notice accounts (can be withdrawn immediately).
• Retail deposits = all bank deposits less than £50,000 + building society deposits which require less than 1 month notice.
• Wholesale deposits = deposits £50,000.
• Time deposits = bank accounts requiring notice.
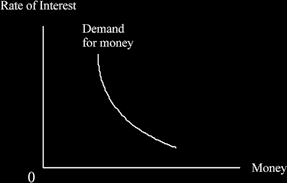
The demand for money
Keynes postulated three demands for money to hold (rather than use to buy bonds). This is called “the liquidity preference theory”.
1. Transactions demand = to buy things with in normal daily life.
2. Precautionary demand = in case anything goes wrong, it is good to have some cash around for the sudden emergency.
3. Speculative demand = to buy bonds when one is ready to do so. This demand is our focus of attention.
When the price of bonds is high, the rate of interest must be low (why? See below “Monetary Policy”), so people expect bonds to fall in price; therefore it is sensible to hold money (demand money) to buy the bonds later. So at low rates of interest, more money
to hold is demanded. This gives us a normal shaped demand curve.
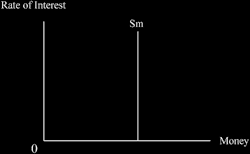
Determining the rate of interest = the supply of and the demand for money
We know the demand curve – it just is what it is. And the supply of money at any point in time is fixed (by the Monetary Policy Committee of the Bank of England). Because it is fixed, it is represented as a vertical line.
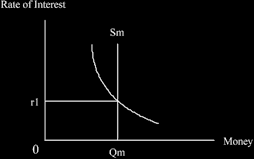
Putting the demand for and the supply of money together, we can see the equilibrium level of the rate of interest.
MONETARY POLICY
Monetary policy is a second method of controlling the economy (the first was fiscal policy). As you know, since 1997, monetary policy and the fixing of interest rates is undertaken by the Bank of England. The interest rate is set by the Monetary Policy Committee which meets monthly. The government has given the Bank of England an inflation target of 2.5% p.a. to strive for and the Committee has to set the rate of interest to try to achieve that target. Currently (October 2004) the base rate is set at 4.75 per cent but keep an eye on this in the press; it will change.
How does it work?
The Monetary Policy Committee merely announces a change in the central bank rate, e.g., a reduction of half a percent. Practically, to achieve this, the Bank has to buy bonds, which increases their price (via normal supply and demand), which reduces the rate of interest. This is now explained.
If a bond is issued with nominal price of, says £100 and at 10%, it means that this bond will always pay £10 p.a. Then let us assume that the rate of interest falls.
If we choose to invest a new £100 in bonds, we will now get only £5 p.a. back. But the old bond still gives £10 p.a.
Q. How much do you have to investnow to get £10 back?
A. To achieve a return of £10 p.a. a person would need to invest £200 at the new lower
5% interest rate – so an existing bond returning its fixed £10 p.a. must now be worth
£200 also. Therefore the price of the original bond rises to £200. You can see this in the table below.
| Nominal price of bond |
Rate of interest | Amount paid by the bond each year |
Actual market price (what it is worth) |
|
|---|---|---|---|---|
| 1. | £100 | 10% | £10 | £100 |
| 2. | £100 still | 5% | £10 | £200 |
You can see that at a low rate of interest the price of bonds is high and vice versa.
We can see the rate of interest by means of a diagram of the liquidity preference theory of money
When the Bank of England wants to reduce the rate of interest, it buys bonds, pays for them, and this increases the supply of money in circulation. This is known as the Bank engaging in “open market operations”, whether buying or selling.
We can see this happening in the diagram below, when the supply of money increases from Sm1 to Sm2.
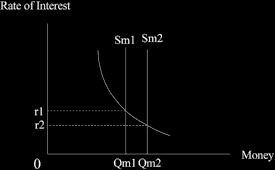
This increase in the money supply in the above diagram ensures the rate of interest falls from r1 to r2.
The reduction in interest rate then leads to an increase in investment done:
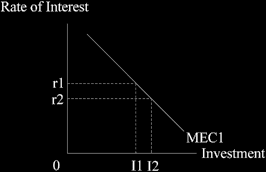
Which in turn causes the level of aggregate demand to increase as the level of investment rises:

So that gross national product rises from GDP1 to GDP2.
And of course employment will certainly increase as the level of GDP rises.
Monetarists v Keynes
In the 1950s and the early 1960s, developed countries followed theKeynesian view. This held that money was not very important in determining the price level; and it was
believed that interest rate changes did not work well to alter spending (which was roughly true back then, although it was based on the situation in the Great Depression through which Keynes lived).
Then the Monetarists emerged – led by Milton Friedman – and they said that the supply of money really did matter. They used an old formula:
MV = PT
Which said that moneytimes velocity (its turn-over) = price leveltimes transactions
(which is a truism i.e., it is always true whatever level these items actually take).
But they went further. If we believe that velocity (V) is stable (that it does not change much) then a change in M = a change in PT.
When we are at full employment, we know that we cannot increase T (by definition! We are unable to produce more), so a change in M must cause a change in P!
For this reason, it was asserted that the supply of money really does matter, and monetary policy was held to be the main one to use.
In the 1960s, Keynesians still felt that fiscal policy was best; but the monetarists wanted to use monetary policy instead. By the 1980s, the monetarists dominated policy making all over the developed world and it looked like the Keynesians might have lost the argument.
However, with the passage of time we found that it was really hard to control the money supply accurately, so the monetarists retreated a bit.
Now: there is no real conflict; there is an amalgam of the two views! At the full employment position, for policy purposes the monetarists dominate; but at low levels of aggregate demand, the Keynesians are predominant!
Some important variables in controlling the economy
• The labour market: if this is flexible (which means that wages can rise and fall easily;
and people can be hired and fired easily) monetarism works well.
- But if the labour market is rigid, the Keynesian approach seems to work better.
- In the UK, the labour market is more flexible than it once was (and more flexible than in much of Europe), so monetarism has improved as an approach to use.
• Time lags: these are longer on the money side – there may be up to two years before the full effects of a change in the supply of money have worked through. With fiscal policy, the changes are almost instantaneous.
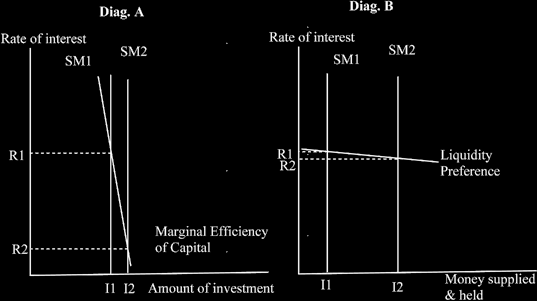
• The shape of the marginal efficiency of capital curve (which is the investment demand curve). If this is very steep, then even a large change in the rate of interest will not alter the level of investment much. (see Diagram A)
• The shape of the liquidity preference curve. If it is very flat, monetarism will not work well, because the rate of interest cannot be reduced much – if the money supply is increased by the Bank of England, people just hold on to the extra money -
(see Diagram B).
• General expectations about the future A):
If people expect higher inflation, then we can have rising pricesand rising unemployment at the same time. The use of monetary policy, and possibly a strict use, may be needed to break these expectations.
• General expectations about the future B):
If business people feel very pessimistic and are perhaps on the edge of panic, the MEC can continually drift to the left. This means that nothing works much when we try to increase the level of GDP, because all the efforts to increase aggregate demand can be offset by shifts in the MEC curve!
• General expectations about the future C):
If business people are hugely optimistic (which means the MEC may shift out rapidly to the right), we may need a strong combination of fiscal and monetary to rein it in.
• Where we happen to be in the trade cycle matters too.
– In a slump, and there is lot of unemployment, Keynesian and fiscal policy works best (i.e., we probably will not use monetary policy, especially on its own).
– In a boom, when we have inflation, we are in the monetarist zone - and monetary policy works well.
– Usually we are in the middle zone! So we tend to use a mix of both fiscal and monetary policies. Government should try to aim them both in the same direction for consistency and to avoid mixing their signals. They are not always able to do this, however, because the government has different departments and many different goals, and this fact may pull some policies in opposite directions.