| Home | Revision | A-Level | Economics | Managing the Economy | Economic growth |
Economic growth
What is economic growth and how is it measured?
Economic growth is the increase in output of the value of goods and services in the country, usually measured over the period of one year.
In a developed country we typically get a figure like 2.5% or 3.1% - but for a fast- growing poor country like China, it may be as much as 7%-10%.
We can see growth as a movement of the production function in an outward direction.
(Here we have chosen to look at growth over four years but annual growth rates often interest us more.)
ppc = production possibility curve.
Starting at C on ppc1, economic growth causes the production possibility curve to shift out to ppc2, to a new equilibrium position at D.
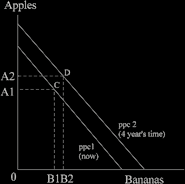
Only two good are shown - but it works for any number – I cannot draw four-dimensional
(or more) diagrams; I am not even good at 3D!
Nominal and real economic growth
Nominal growth includes price changes and, if there has been any inflation, it exaggerates the measured rate of growth. Clearly, if all prices were to double but output were to remain the same, it is not true to think that we have a hundred percent growth rate!
“Nominal rate of growth” = change in GDP over the year (e.g., 2.9%).
“Real rate of growth” = GDP minus the rate of inflation; e.g., if inflation is 1.4%, the real growth rate is (2.9 - 1.4) = 1.5%.
Growth as an indicator of the standard of living
Growth is often seen as most desirable, especially by governments. Growth is one of the ten economic goals (remember these?) and higher growth is often thought to be better, although some people criticise high growth rates for their effects on the environment.
A high growth rate is limited, or perhaps can be even misleading, as an indicator of improved living standards.
Growth over time within one country: limitations as a measure.
NB these points are also virtually identical with problems in the use of GDP per capita as a measure of the standard of living.
Economic growth excludes much that goes into the standard of living – e.g., the environment (air or water pollution, availability of parks and green space; or the numbers unemployed).
The hours worked are not examined: if we all double our hours worked and GDP rises by 5%, it looks good with 5% “growth” - but most would agree that we are actually a lot worse off! Leisure is excluded from measurements of economic growth.
Free services or goods are excluded: for example, the work of housewives or househusbands; all voluntary service like teaching computing for Age Concern; looking after a relative as a carer; and the free exchange of labour in service swap schemes such as babysitting clubs.
A change in GDP can be caused by changes in aggregate demand – if demand falls in one year, growth can be negative – then if demand increases, growth bounces back strongly. This kind of yo-yo effect can be most misleading and careful selection of starting and stopping years can yield opposite results!
Examine the diagram below. If we choose the years T1 and T2, we get a strong growth rate on Line 1. Contrast this with choosing years T3 and T4 on Line 2: there is a negative growth rate!
Be most careful when listening to politicians when they are talking about changes over time; some of them have a nasty habit of selecting those years that favour the argument that they wish to make!
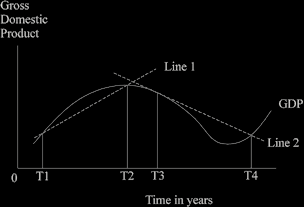
We need to measure “the underlaying rate of growth” to make a sensible comparison over time. This measures what the economy could produce if demand was enough to buy all that was produced.
Measuring economic growth should be done on a per capita basis – if GDP increases
2 per cent but population increases 4 per cent, people are definitely worse off on average.
We know that environmental damage is excluded. A related problem is interesting! If we damage the environment, then spend £100 million putting it back the way it was, the GDP actually increases by £100 million - and on paper we are “better off” and we have growth!
Crime is naturally excluded from GDP as it is not desirable – but if crime increases and we spend £100 million on more police to combat it, then again the GDP rises by
£100 million and on paper we are “better off”. Few would actually feel this to be a real improvement perhaps.
As we enjoy economic growth, it is quite possible for income distribution to have got worse! It is true we have growth, but the standard of living could have fallen for the majority of the population.
Comparing growth between countries can mislead
Slow growth can often conceal a better situation. As an example, let us consider the UK and Egypt. Suppose growth in the UK is 2.2% p.a., but in Egypt 3.3% p.a. This looks good for Egypt, but in reality:
- That country started off so much poorer that the extra one percent growth probably added much less to their output than the UK achieved.
- People probably worked much longer hours in Egypt.
- The population growth in Egypt would almost certainly exceed that of the
UK, so the improvement per head in Egypt could be less than in the UK.
- The death rate in Egypt is higher, life expectancy shorter, and the standard of living is much lower than in the UK.
Countries do not always measure their growth rate in identical ways, although they should for proper comparisons.
The quality of statistical accuracy varies between countries – the UK figures are better, for instance, than the Cambodian ones.
Much more free family work is done in poor developing countries than in richer developed ones – so the figures miss out much real production that takes place in the poor countries.
“The unofficial sector” or “the black economy” is not picked up in the statistics, and the size of this differs between countries, e.g., the black economy is thought to be much bigger in Italy than in Denmark.
Exchange rates can distort the picture; e.g., if France used to exchange US$1 for 10 francs and the exchange rate changes to $1=5 francs, measuring the GDP of France in dollars, looks as if there has been a doubling of GDP as 10 francs now buys $2!
What causes growth? = the sources of growth
It is useful to consider this under the headings of Land, Labour, and Capital + Remainder
O = f (L, N, K) + R
(Recall we did this earlier).
A) Land factors
Natural resource endowments – if a country has diamonds or oil etc, it helps! But the land factor is not enough to give growth on its own, and it is the least important of the growth factors.
B) Labour factors
Labour skills and abilities = education and training. The more of these, the better for growth but it should be of the right kind. India, for example, has been accused of training far too many lawyers and not enough agricultural specialists.
Labour enthusiasm or motivation – the more of this, the better for growth. However, it is not easy to know how to stimulate motivation. Declaring war on someone usually seems to increase it although the British invasion of Iraq did not seem to be popular or have a motivational effect.
Labour numbers – the more the better if they have the skills etc. and the country does not start out with a large labour surplus. More workers are less useful in China or India than they would be in the UK or the USA.
Managers’ ability, training, and enthusiasm. The higher the better.
C) Capital factors
More machinery and equipment = good for growth.
Higher rates of investment = good for growth, because it means more machines etc will be available. Remember that social investment like docks and harbours can pay off too.
Higher rates of saving = good for growth because the country can invest more (in the short term it could harm output if it means that consumers are suddenly not spending as much, but it is generally good for the long term).
Technical progress = good for growth and is the main source of growth in rich developed countries.
Desirability of growth = the case for growth or the benefits of growth
Growth means we can increase the standard of living, increase GDP per head, and spend more on things like welfare, transport, education and health for example.
The growth we achieved in the past is the source of our present living standards, health levels, and lack of illiteracy etc.
Growth means we are able to tackle all our existing problems more easily, because we have the increased resources to do so. We probably need growth for instance, to put right any environmental deterioration.
Growth means if we run into a new problem, it is easier to cope with; we are growing and thus have more surplus to devote to this problem.
Undesirability of growth = the case against growth
It causes environmental degradation by its very nature.
Blind pursuit of growth means we may often ignore the real problems we are facing.
This objection to growth is sometimes a crude “Back to nature” romanticism –
growth is somehow immoral or bad.
Urban congestion, high levels of stress in people, marital breakdowns, generational conflicts and the like may be caused by or at least worsened by our efforts to grow faster.
Growth by developed countries has forced poverty on poor countries (probably a poor case - although the balance of division of gains does favour the wealthy and powerful). Poor countries generally are getting richer than ever before - except where civil wars, invasion or totally unsuitable economic policies have damaged or destroyed the economy. Africa is currently a case in point, with people either slaughtered or starving now or in the past in countries like the Sudan, the Democratic Republic of the Congo, Rwanda, Idi Amin’s Uganda, Charles Taylor’s Liberia and Mugabe’s Zimbabwe.
A few final points about growth
Generally economists favour growth, although we are aware of the damage it can cause.
If you are asked in an exam, it is usually better to decide in favour of growth, after pointing out the various problems that might be associated.
The point that without growth it is harder to improve the world we live in has merit and is often worth mentioning.
And you can say that careful watching and action by government may be highly desirable or essential to put right any undesirable side effects from growth.