| Home | Revision | A-Level | Economics | Managing the Economy | Aggregate demand |
Aggregate demand
This model is the representation of the whole macro economy and this is the diagram we use to analyse any changes in it. It is crucial that you understand this model and be able
to draw it from memory. (Always draw the two axes first and label them – then put in the curves and label them too! Having done this you can then start to move the curves around. Remember! Examiners see too many unlabelled diagrams.)
Some standard abbreviations: Y = income; C = consumption; I = Investment; G = Government; X = exports; M = imports; r = rate of interest; Y = income; L = land; N = labour; K = capital; Ms = money supply; Md = money demanded.
What is aggregate demand?
Aggregate demand is the sum total of all planned expenditures by the people and government.
= Consumption + Investment + Government expenditures + Exports – Imports
= C + I + G +(X – M)
The aggregate demand diagram
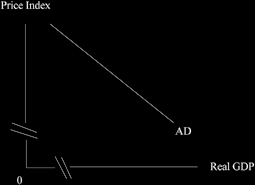
NB. The labels on the axis! This diagram is not the same as the micro demand curve! But if you can cope with the micro one, this one works in a generally similar fashion.
The broken lines merely indicate a gap in the number line – you need not draw these but it impresses a bit if you do! Henceforth I am dropping the break lines in the diagrams, mainly because the diagrams look cleaner that way.
The amount demanded varies at different prices: the lower the price index the more is demanded (the AD curve slopes downward left to right) because of:
• The wealth effect (“the real balance effect”). This says that as prices fall, we are wealthier because we can buy more with the same amount of money. Think about it! If all prices were to halve while you read this page, the money you have in your pocket and elsewhere would buy twice as much.
• The interest rate effect (higher inflation means a higher interest rate, which means less investment and fewer houses are demanded, as well as smaller quantities of other long life assets).
• The foreign trade effect. As our prices rise we are able to sell fewer exports because they are relatively expensive; and we buy more imports which are now– relatively cheaper.
If w slide up the aggregate demand curve we can see what happens as the country suffers more inflation – we demand less in real terms.
Q. What can cause a shift of the aggregate demand curve?
A. Anything that affects C, I, G or X, M For example:
• A change in attitudes: if we experience a reduced desire to save, it means we consume more, so the “C” part increases.
• If the government reduces income tax or other taxes on consumption, we will consume more, so “C” increases.
• A fall in interest rates would lead to an increased demand to buy long-life assets which are usually bought with borrowed money. This means investment rises; perhaps business people buy new machinery which means the “I” part increases.
• An increase in the money supply would reduce the rate of interest, again meaning people invest more so “I” increases.
• If the government decides to spend more it means the “G” part increases.