| Home | Revision | A-Level | Economics | Labour Markets | The supply of labour |
The supply of labour
Much of the analysis of demand and supply in "Markets: How They Work" and "Markets: Why They Fail" applies to labour. The diagrams looks similar and work in the same way – mostly you just have to change the word “price” to “wage” and “quantity” to “quantity of labour”; similarly you alter “supply” to “supply of labour” and “demand” to “demand for labour”.
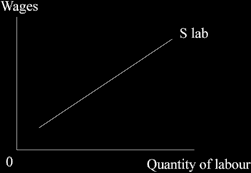
The supply curve of labour is the normal shape; if the firms in an industry are willing to pay a higher wage more people offer themselves to work there.
If I offer the people in your class £1 an hour to vacuum and dust my flat, few would accept I imagine; but for £7 an hour more would be willing to supply their labour; and at
£50 an hour, just about everybody would voluntarily be in the supply curve! That’s the way the world in general behaves also.
Leisure versus work
One reason the supply curve of labour slopes upwards and to the right is that an employer has to offer a higher wage to get more people to work voluntarily, that is to say, give up some of their leisure time.
The income and substitution effects
We call it “the substitution effect” when someone gives up leisure to join the work force (they substitute leisure out for work in). The substitution effect may also work when we
look at those already employed: it is operating if we find that paying them more (such as paying higher overtime rates) persuades them to work for longer hours.
“The income effect” has a different outcome; it exists when people focus on the level of desired income rather than on substituting leisure for work. For instance, if a person has a target income he or she wishes to achieve, then once they have reached that level of income, they may reduce their work hours or even stop working completely. This could happen if they had a target savings goal and the higher income allowed them to stop work earlier.
If an increase in pay leads to fewer people working, or the existing workers choosing to toil for fewer hours, the income effect is said to dominate the substitution effect. This can happen, but it seems to be rare. When it exists, we see a backward sloping supply of labour curve as in the diagram below, as the “S lab” curve bends back at higher levels of wages.
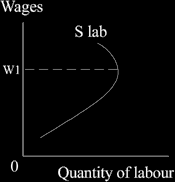
This situation is alleged to have existed in Indonesia before World War Two, as the local workers lacked an incentive to improve their lot much above subsistence level. When colonial companies increased the wages paid above W1, workers would leave because they would reach their target wealth level more quickly.
There is some dispute as to whether this really occurred or not. Some people feel that racism was involved, when a Dutch researcher looked at the attitudes and behaviour of local workers in colonial Indonesia back then. Others feel that it was merely a ploy by the colonial companies to justify paying really low wages.
The working population
The working population consists of all those who are willing to work at the prevailing wage rates, whether they are in employment or unemployed.
It excludes children, the aged, prisoners, house wives and house husbands, some who are rich, some who are “lazy” (i.e. they prefer leisure to work, which means that they have “a high leisure preference”), and all students in full-time education. These are designated as being “inactive”. Those not in the working population are considered to be
“dependents”.
In the UK, the working population in 2004 was close to 29 million people out of a total of
59 million, or 49 per cent of the total (if your are nervous in the exam room and forget the exact figure, simply say “just below half”).