SOLID-LIQUID PHASE DIAGRAMS: TIN AND LEADThis page explains the relationship between the cooling curves for liquid mixtures of tin and lead, and the resulting phase diagram. It also offers a simple introduction to the idea of a eutectic mixture. |
|
|
Important: This page is only really designed to be an introduction to the topic suitable for courses for 16-18 year olds such as UK A level chemistry. Be aware that the phase diagram used is a simplified version of the real thing. In particular, it ignores the formation of solid solutions of tin and lead. I will give a link to the correct phase diagram later. |
|
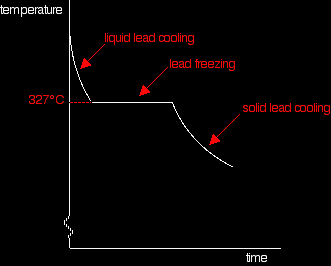
Cooling curvesCooling curves for pure substances Suppose you have some pure molten lead and allow it to cool down until it has all solidified, plotting the temperature of the lead against time as you go. You would end up with a typical cooling curve for a pure substance.
|
|
|
Note: Just before the liquid freezes, there is sometimes a slight dip in the curve below the freezing point. This is called supercooling. As soon as some solid forms, the temperature recovers to the normal freezing point. Supercooling isn't important for the present discussion, so I'm ignoring it on the diagrams. |
|
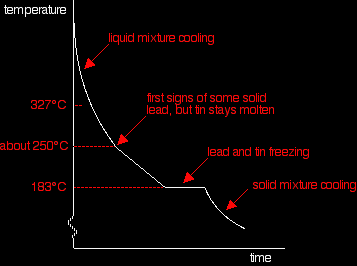
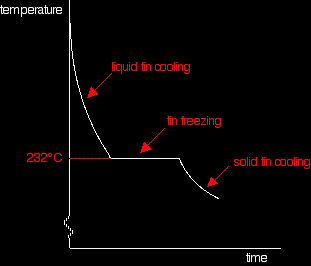
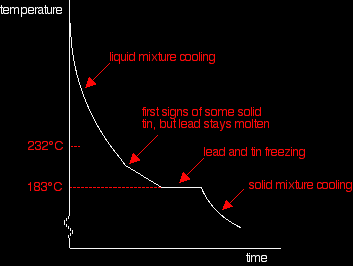
Throughout the whole experiment, heat is being lost to the surroundings - and yet the temperature doesn't fall at all while the lead is freezing. This is because the freezing process liberates heat at exactly the same rate that it is being lost to the surroundings. Energy is released when new bonds form - in this case, the strong metallic bonds in the solid lead. If you repeated this process for pure liquid tin, the shape of the graph would be exactly the same, except that the freezing point would now be at 232°C. (The graph for this is further down the page.) Cooling curves for tin-lead mixtures A sample curve If you add some tin to the lead, the shape of the cooling curve changes. The next graph shows what happens if you cool a liquid mixture containing about 67% lead and 33% tin by mass.
There are lots of things to look at:
Changing the proportions of tin and lead If you had less tin in the mixture, the overall shape of the curve stays much the same, but the point at which the lead first starts to freeze changes. The less tin there is, the smaller the drop in the freezing point of the lead. For a mixture containing only 20% of tin, the freezing point of the lead is about 275°C. That's where the graph would suddenly become less steep. BUT . . . you will still get the graph going horizontal (showing the freezing of both the tin and lead) at exactly the same temperature: 183°C. As you increase the proportion of tin, the first signs of solid lead appear at lower and lower temperatures, but the final freezing of the whole mixture still happens at 183°C. That continues until you have added enough tin that the mixture contains 62% tin and 38% lead. At that point, the graph changes.
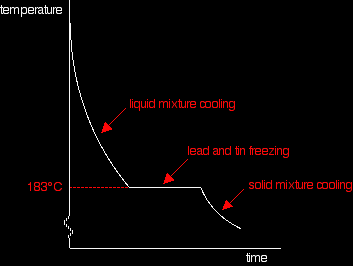
This particular mixture of lead and tin has a cooling curve which looks exactly like that of a pure substance rather than a mixture. There is just the single horizontal part of the graph where everything is freezing. However, it is still a mixture. If you use a microscope to look at the solid formed after freezing, you can see the individual crystals of tin and lead. This particular mixture is known as a eutectic mixture. The word "eutectic" comes from Greek and means "easily melted". The eutectic mixture has the lowest melting point (which is, of course, the same as the freezing point) of any mixture of lead and tin. The temperature at which the eutectic mixture freezes or melts is known as the eutectic temperature. What happens if there is more than 62% of tin in the mixture? You can trace it through in exactly the same way, by imagining starting with pure tin and then adding lead to it. The cooling curve for pure liquid tin looks like this:
It's just like the pure lead cooling curve except that tin's freezing point is lower. If you add small amounts of lead to the tin, so that you have perhaps 80% tin and 20% lead, you will get a curve like this:
Notice the lowered freezing point of the tin. Notice also the final freezing of the whole mixture again takes place at 183°C. As you increase the amount of lead (or decrease the amount of tin - same thing!) until there is 62% of tin and 38% of lead, you will again get the eutectic mixture with the curve we've already looked at.
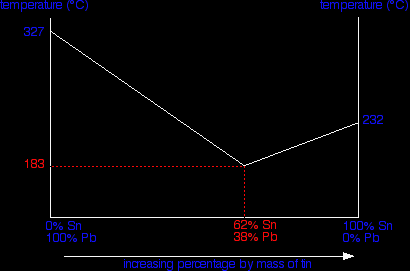
The phase diagramConstructing the phase diagram You start from data obtained from the cooling curves. You draw a graph of the temperature at which freezing first starts against the proportion of tin and lead in the mixture. The only unusual thing is that you draw the temperature scale at each end of the diagram instead of only at the left-hand side.
Notice that at the left-hand side and right-hand sides of the curves you have the freezing points (melting points) of the pure lead and tin. |
|
|
Note: The two lines meeting at the eutectic point have been simplified slightly so that they are drawn as straight lines rather than slight curves. It doesn't affect the argument in any way. I haven't been able to find the actual data to plot them accurately, so the simplification is to avoid giving the impression that I actually know exactly what the curves look like! |
|
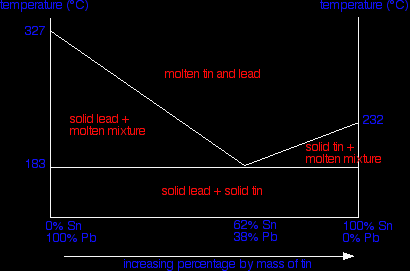
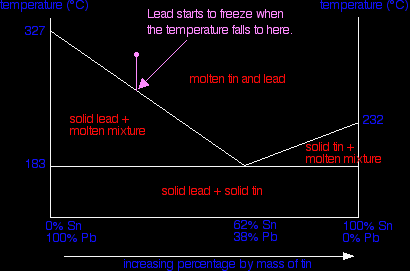
To finish off the phase diagram, all you have to do is draw a single horizontal line across at the eutectic temperature. Then you label each area of the diagram with what you would find under the various different conditions.
|
|
|
Important: This is a simplified version of the real tin-lead phase diagram. In particular, it ignores the formation of solid solutions of tin and lead. You will find the correct diagram on this NIST web page. Beware that on that page, the tin-lead axis is reversed from the one I have drawn above - in other words 100% lead is on the right rather than the left. If you are just using this page as an introduction to this sort of phase diagram, you don't need to worry about this. |
|
Using the phase diagram |
|
|
Important: One of the problems with the various sorts of phase diagrams is that they are all interpreted slightly differently. You can't assume that because you know how to use one sort of phase diagram that you can treat others exactly the same. If you already know about other phase diagrams, look at this one completely afresh. |
|
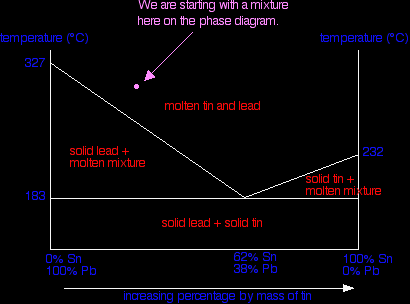
Suppose you have a mixture of 67% lead and 33% tin. That's the mixture from the first cooling curve plotted above. Suppose it is at a temperature of 300°C. That corresponds to a set of conditions in the area of the phase diagram labelled as molten tin and lead.
Now consider what happens if you cool that mixture. Eventually the temperature will drop to a point where it crosses the line into the next region of the diagram. At that point, the mixture will start to produce some solid lead - in other words, the lead (but not the tin) starts to freeze. That happens at a temperature of about 250°C.
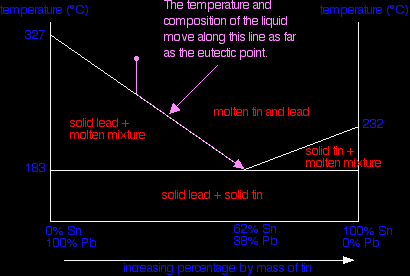
Now, it is the next bit that needs careful thinking about, because there are two different ways you can look at it. If you have been taught to do it one way, then stick with that - otherwise you risk getting very confused! Thinking about changes in the composition of the liquid When the first of the lead freezes, the composition of the remaining liquid changes. It obviously becomes proportionally richer in tin. That lowers the freezing point of the lead a bit more, and so the next bit of lead freezes at a slightly lower temperature - leaving a liquid still richer in tin. This process goes on. The liquid gets richer and richer in tin, and the temperature needed to freeze the next lot of lead continues to fall. The set of conditions of temperature and composition of the liquid essentially moves down the curve - until it reaches the eutectic point.
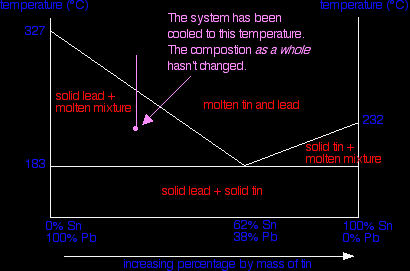
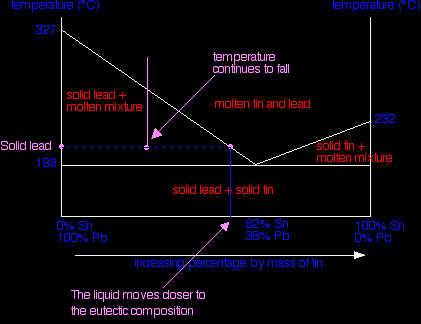
Once it has reached the eutectic point, if the temperature continues to fall, you obviously just move into the region of a mixture of solid lead and solid tin - in other words, all the remaining liquid freezes. Thinking about the composition of the system as a whole We've seen that as the liquid gradually freezes, its composition changes. But if you look at the system as a whole, obviously the proportions of lead and tin remain constant - you aren't taking anything away or adding anything. All that is happening is that things are changing from liquids to solids. So suppose we continue the cooling beyond the temperature that the first solid lead appears and the temperature drops to the point shown in the next diagram - a point clearly in the "solid lead and molten mixture" area.
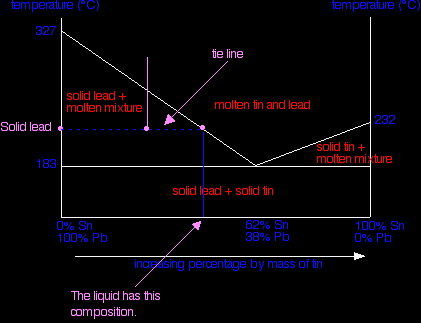
What would you see in the mixture? To find out, you draw a horizontal tie line through that point, and then look at the ends of it.
At the left-hand end, you have 100% lead. That represents the solid lead that has frozen from the mixture. At the right-hand end, you have the composition of the liquid mixture. This is now much richer in tin than the whole system is - because obviously a fair bit of solid lead has separated out. As the temperature continues to fall, the composition of the liquid mixture (as shown by the right-hand end of the tie line) will get closer and closer to the eutectic mixture.
It will finally reach the eutectic composition when the temperature drops to the eutectic temperature - and the whole lot then freezes. At a temperature lower than the eutectic temperature, you are obviously in the solid lead plus solid tin region. That's fairly obvious! If you cooled a liquid mixture on the right-hand side of the phase diagram (to the right of the eutectic mixture), everything would work exactly the same except that solid tin would be formed instead of solid lead. If you have understood what has gone before, it isn't at all difficult to work out what happens. Finally . . . what happens if you cool a liquid mixture which has exactly the eutectic composition? It simply stays as a liquid mixture until the temperature falls enough that it all solidifies. You never get into the awkward areas of the phase diagram. Tin-lead mixtures as solder Traditionally, tin-lead mixtures have been used as solder, but these are being phased out because of health concerns over the lead. This is especially the case where the solder is used to join water pipes where the water is used for drinking. New non-lead solders have been developed as safer replacements. Typical old-fashioned solders include:
To the phase equilibrium menu . . . |
|
