MASS SPECTRA - THE M+2 PEAKThis page explains how the M+2 peak in a mass spectrum arises from the presence of chlorine or bromine atoms in an organic compound. It also deals briefly with the origin of the M+4 peak in compounds containing two chlorine atoms. |
|
|
Note: Before you start this page, it would be a good idea to have a reasonable understanding about how a mass spectrum is produced and the sort of information you can get from it. If you haven't already done so, explore the mass spectrometry menu before you go on. |
|
The effect of chlorine or bromine atoms on the mass spectrum of an organic compoundCompounds containing chlorine atoms One chlorine atom in a compound
|
|
|
Note: All the mass spectra on this page have been drawn using data from the Spectral Data Base System for Organic Compounds (SDBS) at the National Institute of Materials and Chemical Research in Japan. With one exception, they have been simplified by omitting all the minor lines with peak heights of 2% or less of the base peak (the tallest peak). |
|
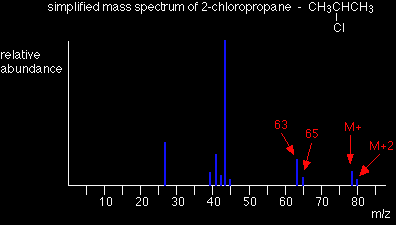
The molecular ion peaks (M+ and M+2) each contain one chlorine atom - but the chlorine can be either of the two chlorine isotopes, 35Cl and 37Cl. The molecular ion containing the 35Cl isotope has a relative formula mass of 78. The one containing 37Cl has a relative formula mass of 80 - hence the two lines at m/z = 78 and m/z = 80. Notice that the peak heights are in the ratio of 3 : 1. That reflects the fact that chlorine contains 3 times as much of the 35Cl isotope as the 37Cl one. That means that there will be 3 times more molecules containing the lighter isotope than the heavier one. So . . . if you look at the molecular ion region, and find two peaks separated by 2 m/z units and with a ratio of 3 : 1 in the peak heights, that tells you that the molecule contains 1 chlorine atom. You might also have noticed the same pattern at m/z = 63 and m/z = 65 in the mass spectrum above. That pattern is due to fragment ions also containing one chlorine atom - which could either be 35Cl or 37Cl. The fragmentation that produced those ions was:
|
|
|
Note: If you aren't sure about fragmentation you might like to have a look at this link. |
|
Two chlorine atoms in a compound
|
|
|
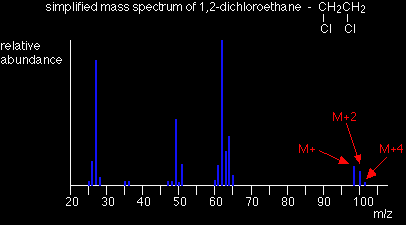
Note: This spectrum has been simplified by omitting all the minor lines with peak heights of less than 1% of the base peak (the tallest peak). This contains more minor lines than other mass spectra in this section. It was necessary because otherwise an important line in the molecular ion region would have been missing. |
|
The lines in the molecular ion region (at m/z values of 98, 100 ands 102) arise because of the various combinations of chlorine isotopes that are possible. The carbons and hydrogens add up to 28 - so the various possible molecular ions could be:
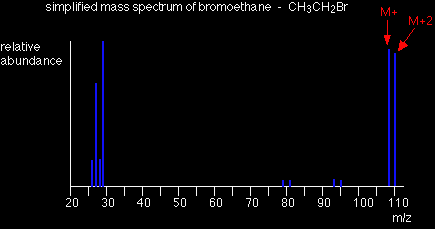
If you have the necessary maths, you could show that the chances of these arrangements occurring are in the ratio of 9:6:1 - and this is the ratio of the peak heights. If you don't know the right bit of maths, just learn this ratio! So . . . if you have 3 lines in the molecular ion region (M+, M+2 and M+4) with gaps of 2 m/z units between them, and with peak heights in the ratio of 9:6:1, the compound contains 2 chlorine atoms. Compounds containing bromine atoms Bromine has two isotopes, 79Br and 81Br in an approximately 1:1 ratio (50.5 : 49.5 if you want to be fussy!). That means that a compound containing 1 bromine atom will have two peaks in the molecular ion region, depending on which bromine isotope the molecular ion contains. Unlike compounds containing chlorine, though, the two peaks will be very similar in height.
The carbons and hydrogens add up to 29. The M+ and M+2 peaks are therefore at m/z values given by:
So . . . if you have two lines in the molecular ion region with a gap of 2 m/z units between them and with almost equal heights, this shows the presence of a bromine atom in the molecule.
|
|


